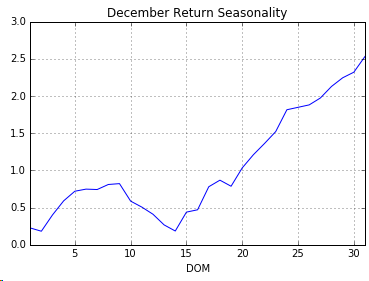
As we approach the last weeks of the year, something to keep in mind for December’s seasonality. X axis is day of month, and Y axis is cumulative return of S&P500 over December for years 1953 to 2016.
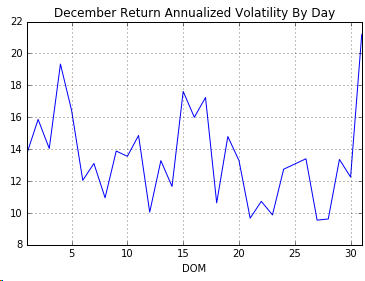
Average returns are nice, but knowing how volatilite it is would also be good to know. Utilizing a pivot table to calculate, the annualized standard deviation for each day is plotted below:
Python Code
import datetime
import pandas_datareader as web
import pandas as pd
import numpy as np

gspc = web.DataReader( '^GSPC', 'yahoo', datetime.datetime(1953,1,1), datetime.datetime(2016, 12, 10))

df = pd.DataFrame( [ gspc['Adj Close'] ] ).transpose()
df.columns=['SPY']
r = df['SPY'].pct_change().shift(-1)
df['SpyRet'] = r
df['DOM'] = df.index.day
df['Month'] = df.index.month

df_dec = df[ df['Month'] == 12 ]
t = pd.pivot_table( df_dec, values='SpyRet', columns='DOM', aggfunc=np.mean)
(t.cumsum()*100.0).plot( grid=True)

t = pd.pivot_table( df_dec, values='SpyRet', columns='DOM', aggfunc=np.std)
(t*np.sqrt(252)*100).plot( grid=True, title='December Return Annualized Volatility By Day')